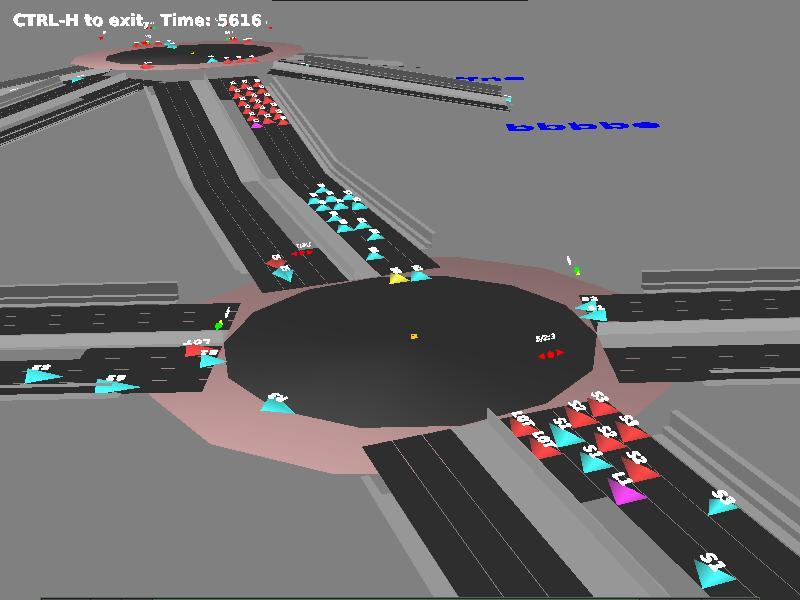
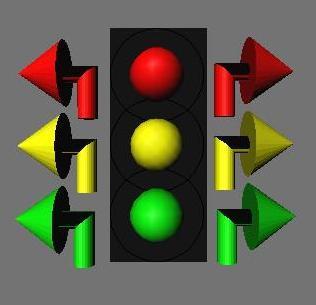
The letters show the "turn preference" for each vehicle at the next intersection (L - left, R - Right, S - Straight, N - Not Applicable). The numbers show the lane that the vehicle is currently using. A trailing 'T' means that the vehicle is in a turnout or turn lane.
The map colors can be changed. The red vehicles are stopped. The cyan vehicles are moving. The yellow vehicles have just run the red light at intersection #2 and are fleeing the scene while looking in the rear view mirror. The magenta vehicles have been 'flagged' ('left turn' and 'lane #1' selected on the color dialog). This flag color overrides all other colors.

The short street names (bbbbw, ccccs, bbbbe, ccccn) are just what I used for testing. The street name field is free form, but you'll probably want to abbreviate for space considerations on the map.

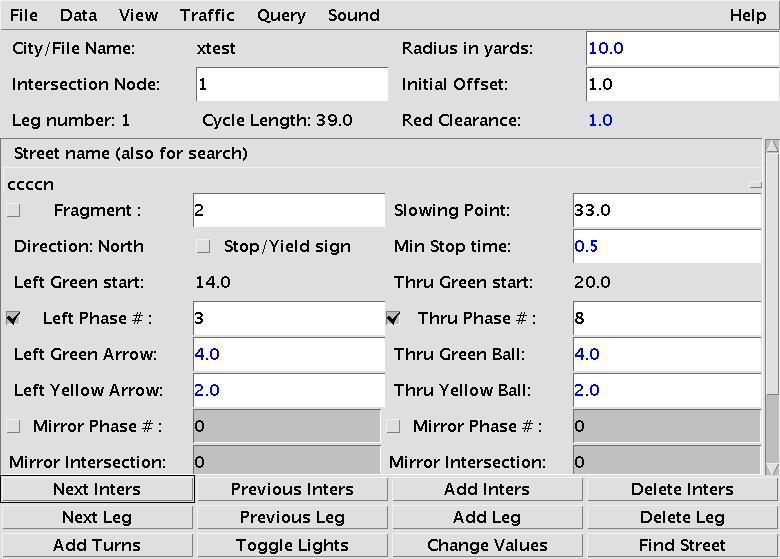
These panels are from Fluxbox (Linux) with the font set to "Easy Reading".
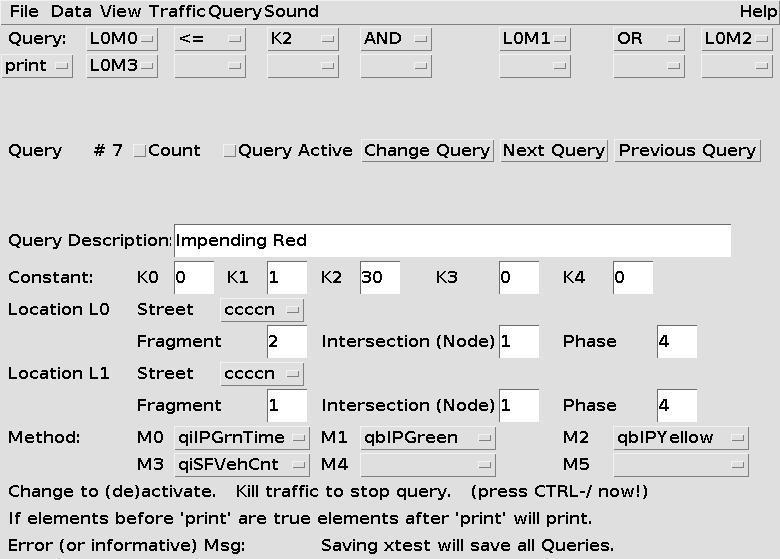
L0M0 <= K2 AND L0M1 OR L0M2 print L0M3
For this example L0 (location 0) is either street ccccn and fragment 2, or intersection 1 and phase 8 (which are two ways of specifying the same location) M0 (method 0) is qiIPGreenTime, K2 is 30 (which is 3.0 seconds), M1 is qbIPGreen, M2 is qbIPYellow and M3 is qiSFVehCount.
(qbIP stands for query, boolean, Intersection, Phase)
qbIPGreen needs (I)ntersection and (P)hase location data and returns
the (b)oolean true when the light is green and false the rest of the time.
(qiSF stands for query, integer, Street, Fragment)
qiSFVehCount needs (S)treet and (F)ragment data and returns the
(i)nteger vehicle count.
The actual report consists of lines which look something like this:
Time 294 ; Vehicle Speed 4.961621 ; Vehicle 0 ; Veh ID 0ccccn@60 ; Street ccccn ; Frag 0 ;
Time 294 ; Vehicle Speed 5.2101116 ; Vehicle 1 ; Veh ID 0ccccn@160 ; Street ccccn ; Frag 0 ;
Time 294 ; Vehicle Speed 6.0911074 ; Vehicle 2 ; Veh ID 0ccccn@40 ; Street ccccn ; Frag 0 ;
I used the following filter (under Linux) to create tabular data:
grep 'Vehicle 1' report.txt | cut -d " " -f 2,6 > Vehicle1.txt
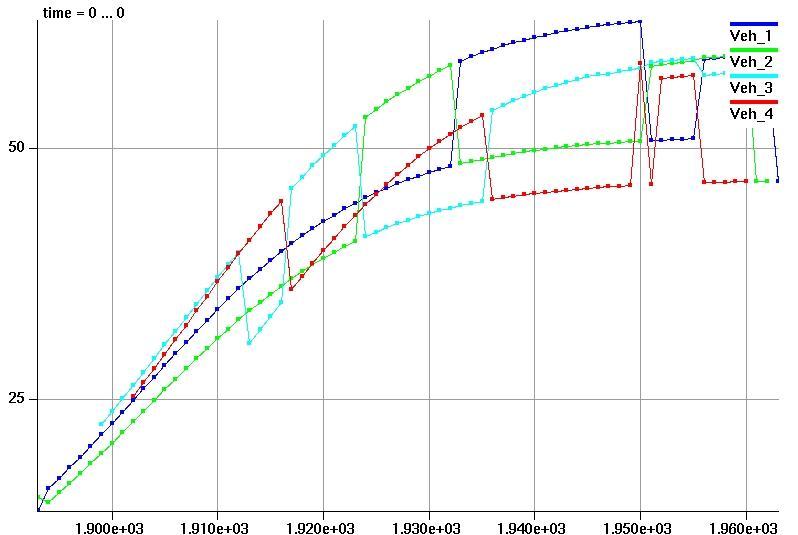
And then used "ygraph" (also under Linux) to create the diagram below. You can see that Vehicle 4 passes Vehicle 3 (and therefore becomes Vehicle 3) just before time 1920. It then does the same thing to Vehicles 2 and 1 and goes on to win the race. The discontinuities at the end happen as vehicles leave the street fragment.
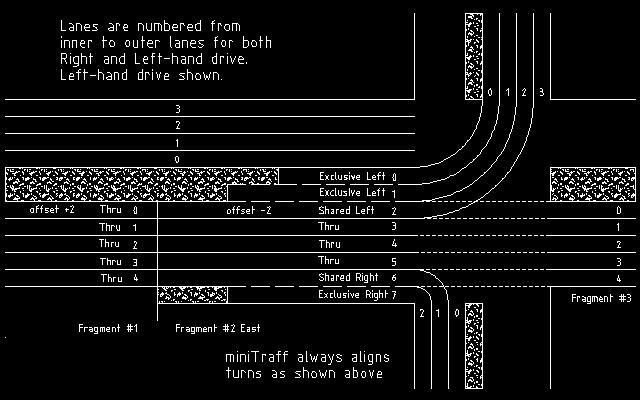
For example one leg of an intersection might have five exclusive left turn lanes, one shared left turn lane, seven thru lanes, one shared right turn lane, and six exclusive right turn lanes. You must have at least one full length lane in a fragment. You can have a maximum of one shared left turn lane and one shared right turn lane or a single lane that is shared for both left and right turns.
Every lane has a usage percent associated with it. This is the percent of total vehicles (left + thru + right) that will use this lane. (although, thru vehicles change lanes as needed to pass slower vehicles)
Copyright (C) 2003-2012 by Ralph L. DeCarli. All rights reserved.
miniTraff and mapTraff are licensed under the Open Software License version 1.1. This software is provided under this License on an "AS IS" BASIS and WITHOUT WARRANTY, either express or implied, including, without limitation, the warranties of NON-INFRINGEMENT, MERCHANTABILITY or FITNESS FOR A PARTICULAR PURPOSE.
Return to the miniTraff home page.